

Complete Guide to Resistance Trending in Predictive Maintenance
Learn how resistance trending helps predict equipment failures, analyze long-term maintenance data, and improve reliability of transformers, circuit breakers, and power systems.
Industrial factories and B2B suppliers rely heavily on high-voltage machinery like power transformers and circuit breakers. To prevent sudden breakdowns, asset managers use a strategic approach called resistance trending. This guide breaks down how logging data over long periods can help you forecast equipment failure months in advance.
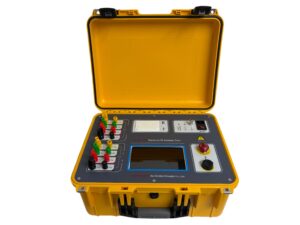
Click the image to know more about Transformer DC Resistance Tester.
What is Resistance Trending in Maintenance?
Resistance trending is a process where technicians track electrical resistance variations in high-voltage assets over time. Instead of looking at a single snapshot, engineers look at historical logs to see how the equipment changes.
For component manufacturers and OEM suppliers, this continuous condition monitoring serves as an early detection system. It reveals tiny, hidden flaws in electrical insulation or contact points that routine, short-term checks completely miss.
Why Should You Track Resistance Data Over 10 Years?
Short-term data only tells you if a machine works today. Decade-long historical logs, however, provide the statistical confidence needed to spot deep degradation patterns.
By analyzing 10 years of data, asset managers at power plants and factories can predict exact failure windows. This strategy helps businesses prioritize which machinery needs a tune-up first, allowing custom OEMs and wholesale operations to protect their supply chains and cut emergency repair costs.
How Does a Change in Resistance Predict Failure?
When high-voltage equipment begins to wear out, its electrical resistance rises. This upward curve usually signals serious underlying issues, such as:
-
Insulation materials breaking down inside transformers.
-
Electrical contact points eroding in circuit breakers.
-
Internal connection joints coming loose.
When the monitored resistance climbs 10% to 20% above the original baseline, the asset is typically 3 to 6 months away from a catastrophic breakdown. Spotting this trend early gives engineering teams a massive lead time to schedule a fix before a factory blowout happens.
What Instruments Deliver the Best Maintenance Data?
Consistent data requires high-precision, industrial-grade testing tools. Handheld or basic meters cannot provide the decade-long stability required for accurate trending. Professional maintenance teams use:
-
Winding Resistance Testers: Ideal for annual checks on heavy-duty power transformers.
-
Contact Resistance Meters: Best for semi-annual inspections on high-voltage circuit breakers.
-
Insulation Resistance Testers: Used quarterly to check the health of major power cables.
Using certified equipment guarantees that your long-term logs represent actual machine wear rather than tool calibration errors.
How Should You Analyze Long-Term Resistance Logs?
To turn raw electrical numbers into actionable business insights, follow a systematic evaluation process:
-
Normalize for Temperature: Always adjust your raw numbers against environmental conditions. Temperature spikes can temporarily alter resistance readings and skew your trend lines.
-
Apply Moving Averages: Use statistical regression and moving averages to smooth out daily operational noise in the data.
-
Set Alerts: Program your asset management system or SCADA software to sound an alarm if readings deviate by 15% from the historical norm, and flag the machine as high-risk if the rise hits 20% to 30%.
-
Integrate Machine Learning: For the highest level of accuracy, use AI models trained on old datasets to map out exact Remaining Useful Life (RUL) timelines.
Frequently Asked Questions
How often should high-load manufacturing plants test resistance?
For optimal safety, test your power transformers once a year, evaluate circuit breakers semi-annually, and inspect primary power cables every quarter.
Can resistance data alone provide a complete picture of machine health?
No. While highly accurate, resistance trending should be paired with other condition-monitoring tools like Dissolved Gas Analysis (DGA) and partial discharge testing for a complete health score.
What are the most common mistakes made during resistance testing?
The two biggest pitfalls are ignoring ambient temperature adjustments and skipping tool calibration. Both mistakes introduce false readings that lead to false alarms or missed faults.
Why is a 10-year historical log better than individual annual tests?
An individual test only shows if a machine passes a specific limit today. A 10-year historical log reveals the exact speed at which the components are decaying, letting you fix machines months before they cross the official failure threshold.
