

Why Low-Frequency FDS Data Is Critical for Transformer Moisture Diagnosis
Find out why low-frequency FDS test data is essential for accurate transformer moisture detection, and how ultra-low frequency curves reveal hidden insulation damp defects.
Why Cannot High-Frequency Testing Detect Transformer Internal Moisture?
Most traditional transformer insulation tests only adopt single high-frequency detection, which can only judge superficial insulation defects. High-frequency signals cannot capture the slow polarization and conductivity changes inside oil-paper insulation, so they fail to identify hidden damp problems in paper insulation and aging defects.
Moisture deeply penetrates transformer paper insulation and changes internal polarization characteristics, which can only be fully reflected in the low-frequency band of dielectric response curves.
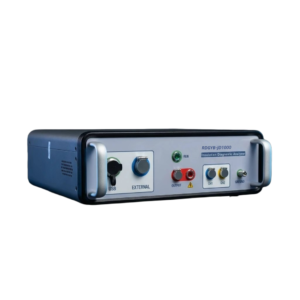
Click the image to know more about Wrindu Frequency Domain Dielectric Response Insulation Diagnostic Analyzer.
What Insulation Information Does Low-Frequency FDS Reveal?
Accurate Polarization State Changes
Low-frequency testing can capture slow polarization behavior of oil-paper insulation. When insulation absorbs moisture, internal molecular polarization speed and intensity change significantly, forming obvious characteristic curves, which is the core basis for moisture quantitative analysis.
Internal Conductivity Variation
Moisture greatly increases insulation conductivity. Low-frequency FDS data sensitively reflects tiny conductivity changes that cannot be detected by high-frequency tests, realizing early warning of slight damp faults.
Hidden Paper Insulation Damp Defects
Transformer paper insulation is the main moisture storage medium. Low-frequency response is highly sensitive to paper moisture, making up for the defect that oil testing cannot reflect paper insulation humidity.
How to Distinguish Moisture and Aging via Low-Frequency FDS Curves?
Both damp insulation and aging insulation will cause increased dielectric loss, but their low-frequency curve trends are completely different. Excessive moisture leads to a sharp rise in low-frequency dielectric loss, while insulation aging causes gentle and stable loss changes in the full frequency band. Professional technicians can accurately distinguish the two faults through curve comparison.
What Problems Will Ignoring Low-Frequency Data Cause?
Without low-frequency FDS analysis, engineers can only rely on oil sample testing and high-frequency parameters, which easily cause missed judgment of hidden paper moisture and misjudgment of aging faults. This will lead to delayed maintenance, accelerated insulation aging, and even transformer short-circuit and breakdown risks in severe cases.
FAQs About Low-Frequency FDS Moisture Diagnosis
Q1: Why is low frequency more sensitive to transformer moisture?
A: Low-frequency signals can capture slow polarization and conductivity changes of damp paper insulation, which high-frequency testing cannot detect.
Q2: Can low-frequency FDS distinguish moisture from insulation aging?
A: Yes. Their low-frequency curve trends are different, enabling accurate fault classification and targeted maintenance.
Q3: What happens if only high-frequency insulation testing is performed?
A: Hidden paper moisture defects will be missed, leading to inaccurate insulation health assessment and potential equipment safety hazards.
Q4: What is the key low-frequency range for transformer moisture detection?
A: The ultra-low frequency range from 0.1mHz to 1Hz is the most critical for judging paper insulation moisture.
