

How to Interpret Frequency Domain Dielectric Response Test Results for Transformer Diagnosis?
Learn how engineers interpret Frequency Domain Dielectric Response test results, including curves, parameters, and abnormal insulation conditions.
Introduction
Collecting FDS measurement data is only the first step.
The most important part is understanding what the results indicate about transformer insulation condition.
A professional FDS analysis combines:
- Measurement curves
- Historical data
- Transformer design information
- Environmental conditions
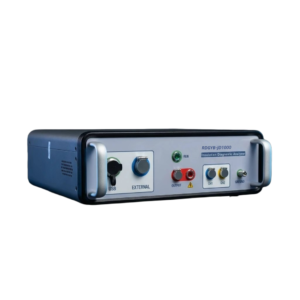
Click the image to know more about Wrindu Frequency Domain Dielectric Response Insulation Diagnostic Analyzer.
What Information Is Included in an FDS Test Report?
A typical FDS report contains:
Dielectric Response Curve
Shows insulation behavior across different frequencies.
Capacitance Data
Provides information about insulation structure changes.
Dielectric Loss Results
Indicates energy loss characteristics.
Diagnostic Evaluation
Provides insulation condition analysis.
How Should Engineers Read an FDS Curve?
Engineers usually examine:
Low Frequency Region
Sensitive to:
- Moisture
- Conductivity changes
Medium Frequency Region
Related to:
- Polarization behavior
High Frequency Region
Associated with:
- Geometric insulation characteristics
What Abnormal Results May Indicate Insulation Problems?
Possible abnormal patterns include:
Increased Dielectric Loss
May indicate:
- Moisture
- Contamination
- Aging
Changed Curve Shape
May suggest:
- Insulation structure changes
- Abnormal polarization behavior
Increased Capacitance
May indicate:
- Insulation condition changes
- Mechanical issues
Why Should FDS Results Be Compared With Historical Data?
A single test provides current condition information.
Trend analysis provides more value.
Comparing previous measurements helps identify:
- Deterioration speed
- Aging trend
- Maintenance timing
How Does Software Improve FDS Diagnosis?
Modern FDS analyzers use analysis models to support engineers.
Functions may include:
- Curve comparison
- Data storage
- Automatic evaluation
- Report generation
FAQs
Q1: What does an FDS curve show?
An FDS curve shows how transformer insulation responds at different frequencies.
Q2: Can engineers diagnose transformer faults only from FDS results?
FDS results should be combined with other information such as operating history and additional tests.
Q3: What causes abnormal FDS curves?
Possible causes include moisture, insulation aging, contamination, or structural changes.
Q4: Why are historical FDS records important?
They help identify insulation deterioration trends over time.
